RSS


Langley City Houses

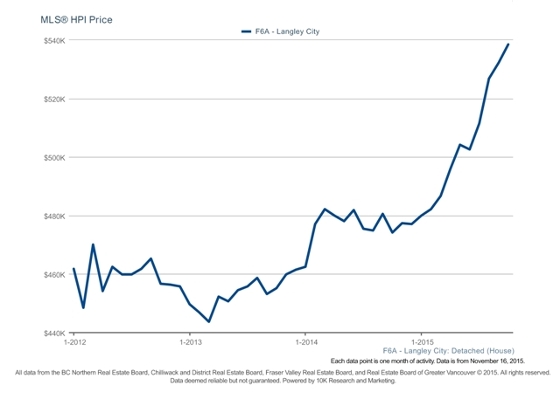
No end in sight for house prices! It's been a steady increase with prices up 13.6% from October last year.

With only 32 active listings and 19 sales there is a huge shortage of homes for sale creating a sales to active listing ratio of 59.4%. A very strong sellers market! Average days on market to get these homes sold was 31 days.


Langley City Townhouses

Langley City Townhouse prices have seen a lot of fluctuation this year but the Home Price Index shows a prce incease of 5.5% from the same time last year.  5 of the 19 active listings sold resulting in a sales to active listing ratio of 26.3% which indicates a balanced market. It took an average of 21 days to get these homes sold.


Langley City Apartments

Langley City Apartments prices are holding their own and  have crept up ever so slowly this year with prices up just 2.2% from October 2014.  26 out of 121 active listings sold creating a sales to active listing ratio of 21.5% which is just slightly higher than a Buyers market and at the very bottom end of a balanced market.The average days on market to sell one of these homes was 48 days


Read

Langley City Apartments

Langley City Apartment prices rebounded slightly in March but prices are still down 10.4% compared to March of last year.  On the plus side 26 out of 140 active listings sold bringing the sales to active listing ratio up to 18.6%. This is a good sign as more interest in the condo market should help stabilize prices.  The average time on market to achieve a sale was 55 days.


Langley City Townhouses

Prices are on the rise and up 3.5% from March of last year. 13 out of 35 homes sold bringing the sales to active listing ratio up to 37.1%. This is the best sellers market we have seen for quite some time. The average time on market to achieve a sale was 53 days. Things are looking good for Langley City Townhouses.


Langley City Houses

House prices are continuing to rise at a moderate rate and are up just .9% from one year ago. Considering 30 out of 35 Active listings sold in March bringing the Sales to Active listing ratio to 85.7% We can expect to see a stronger rise in prices than we have seen in the past few months. The average time to get a home sold was just 15 days.


Read

Langley City Homes


Langley City Detached Home sales have faired well this past year and it has been a pretty steady market with home prices up 3.8% in January compared to the same time last year. There were 39 active listings and only 5 sales in January giving us a sales to active listing ratio of 12.8%. Still a Buyers market resulting in an average of 66 days on market to get a home sold.


Langley City Townhouses


Langley City Townhouse sales had a pretty good 1st quarter But it was almost all down hill from there and in the end values as of January this year were up just .4% from the same time last year. With 34 active listings and only 5 sales in January the Sales to Active listing ratio was 14.7%. Although this indicates it is still a Buyers market it is not too far from reaching a balanced market of 18%. The average days on market to achieve a sale was 61 days.


Langley City Apartments


Langley City Apartment sales had a very tough 4th quarter in 2014.

Our Home Price Index shows a price drop of 8.5% compared to this same time last year.

With 115 active listings and only 10 sales in January the sales to active listing ratio is just 8.7%.

This indicates a strong buyers market and is well below a balanced market which begins at 18%.

Homes that did sell took an average of 89 days on market.


Read


Are you thinking of selling your home? If you're one of the many homeowners who choose this time of year to move — whether you're trading up or down, or simply relocating — you're probably starting to prepare your home for the sale.

Before you become overwhelmed by the task, it's a good idea to sit down and look at your home objectively. An attractive, well-kept home generally has a better chance of selling a little faster. Also, the old adage "first impressions are lasting ones" is very true.

If you haven't made substantial improvement or changes over the years, it's not a good idea to take on major renovation projects simply to sell your home. This can be an expensive and lengthy procedure and there are no guarantees that you'll be able to recover all of your costs.

Instead, try to determine what types of minor cosmetic improvements can be made, like general cleaning, painting, floor refinishing, and so on. These projects generally don't require a lot of capital and your home can be greatly improved by them. Consult with your REALTOR® to see what types of improvements make the most sense.

Start with the outside

An inviting exterior ensures that potential buyers will inspect the interior, so it's important to keep your lawn and hedges trimmed and edged, the flower beds cultivated, and your yard free and clear of clutter and refuse. If you have any loose siding or pavement, it's a good idea to get these items repaired. And it you have any cracked or broken windows, get them fixed as well.

Missing shingles or eavestroughs should also be replaced and loose shutters or awnings secured. You may also want to consider painting the exterior of your home to spruce it up a little. And if you have aluminum or vinyl siding or trim that's quite dirty, hire someone to clean it with a power washer, if you can't or don't want to wash it yourself.

If you have a garage, make sure the door is clean, attractive and in good working order. Also make sure the inside of your garage doesn't look too cluttered or unorganized. Keep patios, walkways and decks free of debris and clutter.

The inside story

You can do a lot on the inside of your home as well without spending a great deal of money. Two primary areas to keep in mind are the kitchen and bathroom. These two rooms of your home are generally of prime interest to potential buyers. Make sure they're clutter-free, bright and spotless. This applies to kitchen appliances as well, especially if you're including them with the sale of the home. Scrub sinks, toilets, bathtubs and kitchen appliances until they shine.

If the carpeting in your home looks dirty or dingy, you may want to rent a steam cleaner, or hire a professional carpet cleaner. Pet odours become trapped in rugs and this can repel prospective buyers.

Give your home a thorough cleaning and if you've been cooking, ensure you air the home prior to its showing. Make sure any wood and tile floors look clean and bright, not dull and dingy. Get to those easy-to-miss spots that need a good cleaning. Wash down the walls, windows and woodwork. Clean out the cupboards and under the sink, dust the tops of baseboards and wash all window coverings.

As well, keep in mind that rooms that are too cluttered will give the impression that they're much smaller than their true size. Try to create a feeling of spaciousness when conducting your spruce-up. Pack away bulky or unused furniture and make the best use of your space. Be ruthless when you go through closets, spare rooms and cupboards. If you haven't used that bread-making machine in a while, and if you're not likely to need that extra set of china in the next few weeks, pack it away. Those knick-knacks on the mantelpiece may have sentimental value to you, but they'll just look like knick-knacks to the people who come through your home. Take a deep breath and move them out of sight. You can get a head start on packing by cleaning off bookshelves, and clearing away out-of-season clothes, toys, bedding, sports equipment and garden tools.

Now is the time to fix the cracked light-switch plates, broken door handles, leaky faucets and squeaky doors you've learned to live with for years.

Shabby corners and grubby entranceways will benefit from a fresh coat of pain in a neutral colour - this is not the time to start experimenting with dramatic paint schemes. Similarly, heavily patterned wallpaper or brightly coloured accent walls may tend to distract buyers from other features, or make it hard for them to imagine how their belongings will look in the room. If you can, repaint or paper the walls in a subtle colour.

Pre-showing checklist:

  • Whenever possible, try to be out of the house while the REALTOR® is conducting a showing. (Potential purchasers often feel like intruders when homeowners are present.)
  • Keep pets well out of the way — preferably out of your house during the showing. (Potential purchasers who are afraid of or allergic to pets will not wish to view your home.)
  • Make sure your home is tidy and well aired. Ensure that every room is adequately lit.
  • Remove any items (like chandeliers) which won't be included in the sale of the home.
  • Don't keep money, jewellery and small valuables in plain sight during a showing.
Read

   Lower inventory keeps home prices in check as ‘slow
but steady’ market continues.


SURREY, BC – In March, the Fraser Valley Real Estate Board processed 1,128 sales on its Multiple Listing Service®
(MLS®), a 20 per cent decrease compared to the 1,412 sales during the same month last year, and a 24 per cent
increase compared to February’s 913 sales.
The Board also received 11 per cent fewer new listings in March compared to last year – 2,736 compared to 3,066
– keeping inventory in check. March finished with 9,503 active listings, 1.5 per cent fewer than March of last year
and 3.5 per cent fewer than the 9,832 available during March of 2009; the highest volume of active listings for that
month in the last decade.
Ron Todson, President of the Board, explains, “Although we saw a typical spring uptick in activity from February to
March, our sales remained at about 70 per cent of the norm for March and our new listings came in at 90 per cent
of what the Board would typically receive.
“Because inventory levels are in check, prices are staying in check.”
In March, the benchmark price of single family detached homes in the Fraser Valley was $544,300, an increase of
0.6 per cent compared to $541,300 during the same month last year. For townhouses, the benchmark price was
$298,200, a decrease of 1.7 per cent compared to $303,400 in March 2012 and the benchmark price of apartments
was $204,200, an increase of 0.8 per cent compared to $202,500 in March 2012.
Todson adds, “Inventory levels are not as high as they need to be to put significant downward pressure on prices
of the benchmark, or ‘typical’ home. These are homes that have characteristics most common to houses in a given
community.
“In fact, we’re seeing the reverse happen. Benchmark prices for all three main property types in the Fraser Valley
increased in value during the first quarter of 2013. Since January, detached homes are up by 1 per cent,
townhomes by 0.6 per cent; and apartments by 2 per cent.”


Langley City


Townhouses:


The Benchmark price for a typical townhouse was $259,500. Up $2,100 from last month.

There were15 reported sale compared to 2 in the previous month. Average selling time was 29 days on market.

This months sale prices reflect an increase of .48% compared to 6 months ago, up 6.22% from 3 years ago and up 2.83% from 5 years ago.


Apartments:


The Benchmark price for a typical Apartment was $218,800. down $800 from last month.

There were 19 reported sales compared to 19 the previous month. Average selling time was 48 days on market.

This months sale prices reflect a .21% drop compared to 6 months ago but up 5% from 3 years ago and down 1.9% from 5 years ago.


One Storey Detached:


The Benchmark price for a typical one storey home was $435,000. Down $3,100 from last month.

There were 14 reported sales compared to 8 the previous month. Average selling time was 44 days on market.

This months sale prices reflect a 4.08% drop compared to 6 months ago, a 6.43% drop from 3 years ago and a .42% drop from 5 years ago


Two Storey Detached:


The Benchmark price for a typical 2 storey home was $470,500.  Down $4,100 from last month.

There were 6 reported sales compared to 3 the previous month. Average selling time was54 days on market.

This months sale prices reflect a 5.92% drop compared to 6 months ago, a 3.02% drop from 3 years ago and a 3.78% drop from 5 years ago.


The Benchmark price represents the price of a typical property within each market.


Read

Positive signs Fraser Valley housing market is starting to move.


SURREY, BC – Sales on Fraser Valley’s Multiple Listing Service® (MLS®) in February experienced a typical ‘early
spring’ surge, increasing by 48 per cent in one month going from 617 sales in January to 913 last month. However year‐over‐year, they reflect a decrease of 28 per cent compared to the 1,269 sales processed in February 2012. Since last September, home sales have idled at levels last seen in the early 2000s.
Based on February’s increase in activity, Ron Todson, President of the Board, is guardedly optimistic, “We’re seeing signals that the stand‐off between buyers and sellers over the last six months is coming to an end.
“Business has picked up in the last month with increased traffic at open houses, sellers quicker to accept offers and homes selling on average two weeks faster than they did in January.”
Todson adds that tightening inventory has also had an effect, “When buyers see that their selection is diminishing
they’re more motivated to act.” The Board posted 2,582 new listings last month, a decrease of 9 per cent
compared to the 2,846 posted during February last year pushing the total number of active listings down by 1.6
per cent compared to 2012.
“As your REALTOR® will explain, each market is different. Right now, the market for detached homes is balanced in North Delta and Langley. The condo market is brisk in Abbotsford and Central Surrey and townhome sales are
steady in North and Central Surrey as well as Cloverdale.
“One commonality amongst these areas and property types is greater affordability. What’s not doing well
generally anywhere in the Fraser Valley is sales of higher‐end homes unless they are priced competitively.”
In February, the benchmark price of single family detached homes in the Fraser Valley was $540,900, an increase
of 0.7 per cent compared to $537,200 during the same month last year. For townhouses, the benchmark price was $296,700, a decrease of 1.3 per cent compared to $300,500 in February 2012 and the benchmark price of
apartments was $202,500, an increase of 1.5 per cent compared to $199,500 in February 2012.
In February, it took on average 49 days to sell a detached home compared to 64 days in January. Townhomes took 60 days on average to sell compared to 72 days the month before and apartments spent an average of 66 days on the market in February compared to 83 days in January.


Langley City


Townhouses:


The Benchmark price for a typical townhouse was $257,400. Down $15,000 from last month.

There were2 reported sale compared to 7 in the previous month. Average selling time was74 days on market.

This months sale prices reflect a drop of 1.77% compared to 6 months ago, up 5.03% from 3 years ago and up 2.64% from 5 years ago.


Apartments:


The Benchmark price for a typical Apartment was $219,600. Up $9,900 from last month.

There were 19 reported sales compared to 26 the previous month. Average selling time was 74 days on market.

This months sale prices reflect a .27% drop compared to 6 months ago but up4.99% from 3 years ago and down .41% from 5 years ago.


One Storey Detached:


The Benchmark price for a typical one storey home was $438,100. Down $2,700 from last month.

There were 8 reported sales compared to11 the previous month. Average selling time was 35 days on market.

This months sale prices reflect a 2.34% drop compared to 6 months ago, a .14% increase from 3 years ago and a .85% increase from 5 years ago


Two Storey Detached:


The Benchmark price for a typical 2 storey home was $474,400.  Down $1,700 from last month.

There were 3reported sales compared to 5 the previous month. Average selling time was 54 days on market.

This months sale prices reflect a 5.42% drop compared to 6 months ago, a 1.38% drop from 3 years ago and a 3.34% drop from 5 years ago.


The Benchmark price represents the price of a typical property within each market.


Read

Home sales slow to near historic levels in Fraser Valley as
buyers watch and wait from the sidelines.


SURREY, BC – A total of 617 sales were processed through the Fraser Valley Real Estate Board’s Multiple Listing Service (MLS®) in January, a decrease of 23 per cent compared to 799 sales during the same month last year. January 2013 ranks as the second slowest for that month in the last thirteen years, second only to January 2009 during the global recession.
Scott Olson, president of the board, says there is a distinction between what REALTORS® saw four years ago compared to today. “People want to buy. We’re already seeing early signs of a typical spring market with more foot traffic at open houses and an increase in calls.
“Buyers have been holding off in hopes that prices will drop more, however it’s become clear that sellers are only willing to go so far. Prices for typical homes in the Fraser Valley have decreased by only two to three per cent in the last six months and in January we’re starting to see a reversal of that – in half of our communities prices have crept back up.”
Olson suspects the market stalemate may be coming to an end. “The number one reason people buy a home is a
lifestyle decision – you need a bigger home, a smaller one, closer to work or school – so when the right home comes along you can only wait so long.
“With interest rates as low as they are, our local economy as strong as it is and prices so tenacious I think we’ll see the effects of this pent‐up demand and a return to more balance in the market.”
In the last six months, prices for all three residential property types combined have decreased by 2.5 per cent while year over year they’re on par, showing an increase of 0.7 per cent. Of the three property types, prices of single family detached homes have been the most resilient, increasing 1.5 per cent in the last year going from $532,700 in January 2012 to $540,500 last month.
For townhouses, the benchmark price in January was $293,700, a decrease of 2.0 per cent compared to $299,800 during the same month last year. The benchmark price of apartments in Fraser Valley in January was $200,400, an increase of 1.2 per cent compared to $198,000 in January 2012.
REALTORS® added 2,643 new listings in January, 4 per cent fewer than the same month last year. This decreased the number of properties available in the Fraser Valley to 8,031, a decrease of 3.5 percent compared to January 2012. By historical comparison, January 2013 ranks as the third highest in terms of active listings in the last decade.


Langley City


Townhouses:


The Benchmark price for a typical townhouse was $272,400. 

There were 7 reported sales and the  average selling time was 97 days on market.

This months sale prices reflect an increase of 2.56% compared to 6 months ago, up9.25% from 3 years ago and up 9.33% from 5 years ago.


Apartments:


The Benchmark price for a typical Apartment was $209,700. 

There were 26 reported sales and the average selling time was 56 days on market.

This months sale prices reflect a 5.45% drop compared to 6 months ago, a .64% drop from 3 years ago and a 3.74% drop from 5 years ago.


One Storey Detached:


The Benchmark price for a typical one storey home was $448,000. 

There were 11 reported sales and the  average selling time was 49 days on market.

This months sale prices reflect a 1.17% drop compared to 6 months ago, a 2.05% drop from 3 years ago but up 2.07%  from 5 years ago


Two Storey Detached:


The Benchmark price for a typical 2 storey home was $476,100. 

There were 5 reported sales and the  average selling time was 62 days on market.

This months sale prices reflect a 4.94% drop compared to 6 months ago, a 3.74% drop from 3 years ago and a 3.33% drop from 5 years ago.


The Benchmark price represents the price of a typical property within each market.


Read

Fraser Valley's housing market"steady as she goes"


Scott Olson, President of the Fraser Valley Real Estate Board explains, "Our market last month remained consistent. Our sales were down compared to May, however the number of new listings we received dropped as well, which seasonally is typical for June in the Fraser Valley. Although our inventory is trending at historically high levels, sales have remained steady so we are not seeing significant downward pressure on residential prices overall."


Langley City Market Trends

 June 2012


Townhouses:


Number of sales as well as prices continue to trend downward.

3 reported sales in June compared to 9 sales in May.

Active listings 44.

Average days on market 60.


Apartments:


Number of sales trending downward but prices remain pretty steady despite the apparent overabundance of available units. 

11  reported sales in June compared to 29 sales in May .

Active listings 211.

Average days on market 61.


Single Storey Detached:


Number of sales trending downward but prices holding steady

5 reported sales in June compared to 6 sales in May.

Active listings 22.

Average days on market 22. 


 2 Storey Detached:


Number of sales trending Downward but Prices holding steady:

11 reported sales in June compared to 14 in May.

Active listings 29.

Average days on market 24.


Read

Fraser Valley market remains steady;

while selection continues to improve…


There were 1435 property sales processed on the Fraser Valley Real Estate Boards Multiple Listing Service (MLS) in April, reflecting a 5% decrease compared to the 1,516 sales in April of last year, and a slight increase over the 1,412 sales in March.

In April the board added 7% more new listings compared to 1 year ago, 3,134 in contrast to 2,918 in April 2011, pushing the number of properties for sale in the Fraser Valley to 10,312, the highest level since July 2010.


Scott Olson, President of the Board says “To put it in perspective, in the last decade , April 2012 ranked second lowest for sales during that month, while new listings came in at the third highest, meaning it is a good time to be shopping for a home in the Fraser Valley because selection has only been this extensive twice.”


Langley City Market Trends

April 2012


Townhouses:

Prices continue to struggle and trend downward.

12 reported sales. Active listings 44. Average days on market 46.

The Benchmark price of a Langley City Townhouse in April was $243,00, down .29% from the previous month and 2.64% lower than 6 months ago. Shockingly, statistics show a 4.88% drop in price from one year ago.


Apartments:

Prices remain pretty steady despite the apparent overabundance of available units. 

15 reported sales. Active listings 209. Average days on market 72.

The Benchmark price of a Langley City Apartment in April was $209,300, up .44% from the previous month but still .79% lower than 6 months ago. Statistics show a 2.05% drop in price from 1 year ago.


Single Storey Detached:

Prices continue to drop.

10 reported sales. Active listings 21. Average days on market 48. 

The Benchmark price of a Langley City single storey detached home in April was $444,700, down 4.31% from the previous month and 1.10 % lower than 6 months ago. Statistics show an increase in price of 4.34% over 1 year ago.


2 Storey Detached:

Prices continue to struggle and trend downward:

8 reported sales. Active listings 29. Average days on market 35.

The Benchmark price of a Langley City 2 storey detached home in April was $482,000, down .65% from the previous month and 5.14% lower than 6 months ago. Statistics show prices are 2.07% higher than 1 year ago.


Read
Reciprocity Logo The data relating to real estate on this website comes in part from the MLS® Reciprocity program of either the Greater Vancouver REALTORS® (GVR), the Fraser Valley Real Estate Board (FVREB) or the Chilliwack and District Real Estate Board (CADREB). Real estate listings held by participating real estate firms are marked with the MLS® logo and detailed information about the listing includes the name of the listing agent. This representation is based in whole or part on data generated by either the GVR, the FVREB or the CADREB which assumes no responsibility for its accuracy. The materials contained on this page may not be reproduced without the express written consent of either the GVR, the FVREB or the CADREB.