Langley City Houses
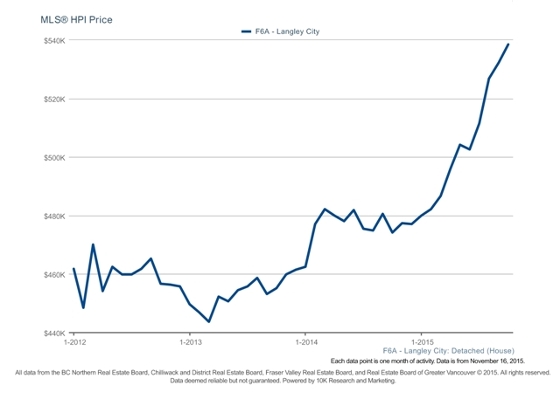
No end in sight for house prices! It's been a steady increase with prices up 13.6% from October last year.
With only 32 active listings and 19 sales there is a huge shortage of homes for sale creating a sales to active listing ratio of 59.4%. A very strong sellers market! Average days on market to get these homes sold was 31 days.

Langley City Townhouses
Langley City Townhouse prices have seen a lot of fluctuation this year but the Home Price Index shows a prce incease of 5.5% from the same time last year. 5 of the 19 active listings sold resulting in a sales to active listing ratio of 26.3% which indicates a balanced market. It took an average of 21 days to get these homes sold.
Langley City Apartments
Langley City Apartments prices are holding their own and have crept up ever so slowly this year with prices up just 2.2% from October 2014. 26 out of 121 active listings sold creating a sales to active listing ratio of 21.5% which is just slightly higher than a Buyers market and at the very bottom end of a balanced market.The average days on market to sell one of these homes was 48 days


Comments:
Post Your Comment: